

150 Years in 5 Charts
The ingenuity and resilience of humans is amazing. And by extension, the creativity and adaptability of businesses and the economy is a reflection of that.
While the bond market is seizing up and the stock market is trying to find a bottom, the companies and workers of our every day economy are finding a way to stay in business and deliver.
We have faced massive disruptions before. We need to put this crisis in perspective. Even though we don’t know how long it will last or how deeply it will impact us, this is not the first time we have had to adapt. In many ways, we are more capable to handle this than in any time in the past, thanks to technology, medical advances, and improved communication.
Post-Civil War
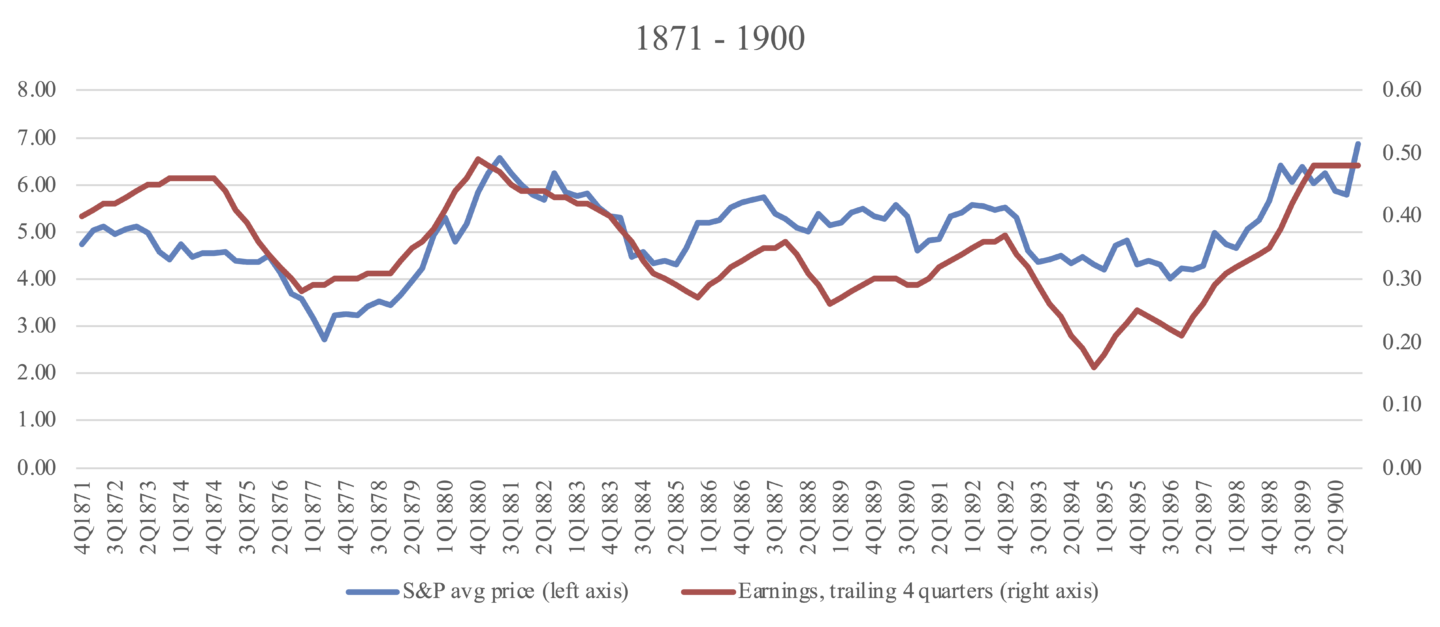
Source: Dr. Robert Shiller, Yale School of Management; Business Insider; Archer Bay Capital LLC
The Standard & Poor’s Index was created in 1957. It is such a useful representation of the US stock market that a proxy of it was reconstructed dating back to 1871 by the Yale professor and Nobel laureate in economics, Dr. Robert Shiller. This data comes from his research.
When stock prices and company earnings are charted together, it is easy to recognize how they move together.
In the late 1800s, the US economy was going through extreme changes – reconstruction after the Civil War, massive immigration, westward expansion, booms and busts and bank failures. America was an emerging economy back then. The struggle for profits and an unreliable stock market reflect it. There were no securities laws to protect investors from shams, monopolies were legal, there was no central bank to manage financial panics, and banks printed our currency. If the bank went under, your paper money was worthless.
Panic of 1907, World War I, Spanish Flu, Great Depression, World War II
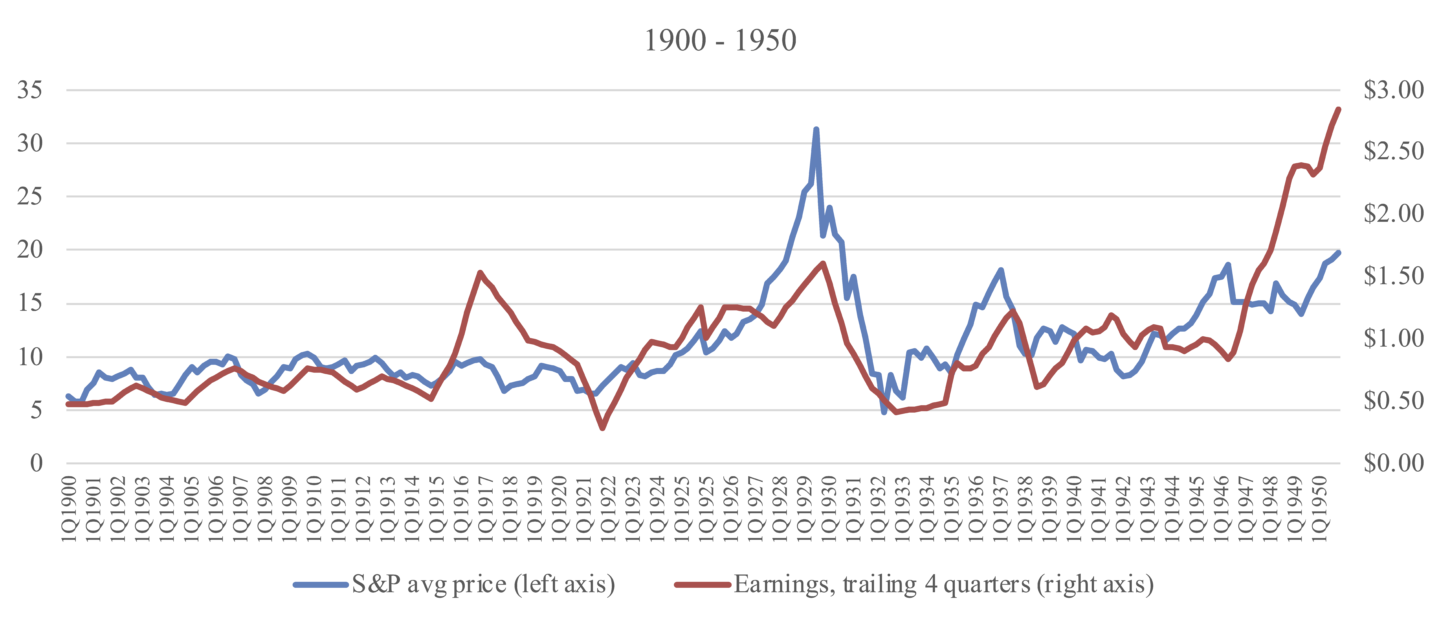
Source: Dr. Robert Shiller, Yale School of Management; Business Insider; Archer Bay Capital LLC
It is difficult to imagine how scary the first fifty years of the twentieth century was. Every decade had a new existential crisis. So much uncertainty and so much destruction. The human cost was enormous.
It is easy to see the spike in profits up to 1917 when US companies were selling supplies to the Europeans before we entered the war. Then its subsequent fall during war, which included the Spanish flu epidemic in 1918, followed by the wind down from the war effort. It’s difficult to draw a perfect stock market parallel from today with the 1918 flu because we also had the war ending and production demand falling at the same time. Times were bad, especially in Europe.
Everyone knows the stock market crash in 1929. Speculation was sport and stock prices far exceeded earnings growth. We had a slow climb out of the Depression. Once World War II was over and the soldiers came home, corporate profits grew rapidly but investors were suspicious of the stock market and prices lagged profits.
The financial world as we know it started here. Income tax to provide the government with consistent revenue, the Federal Reserve to oversee the orderly functioning of the financial markets, FDIC-insured bank deposits, Social Security as a safety net for citizens, and securities law to protect investors passed in 1933.
The Cold War, Korean and Vietnam Wars, Oil Embargoes, Labor Strikes
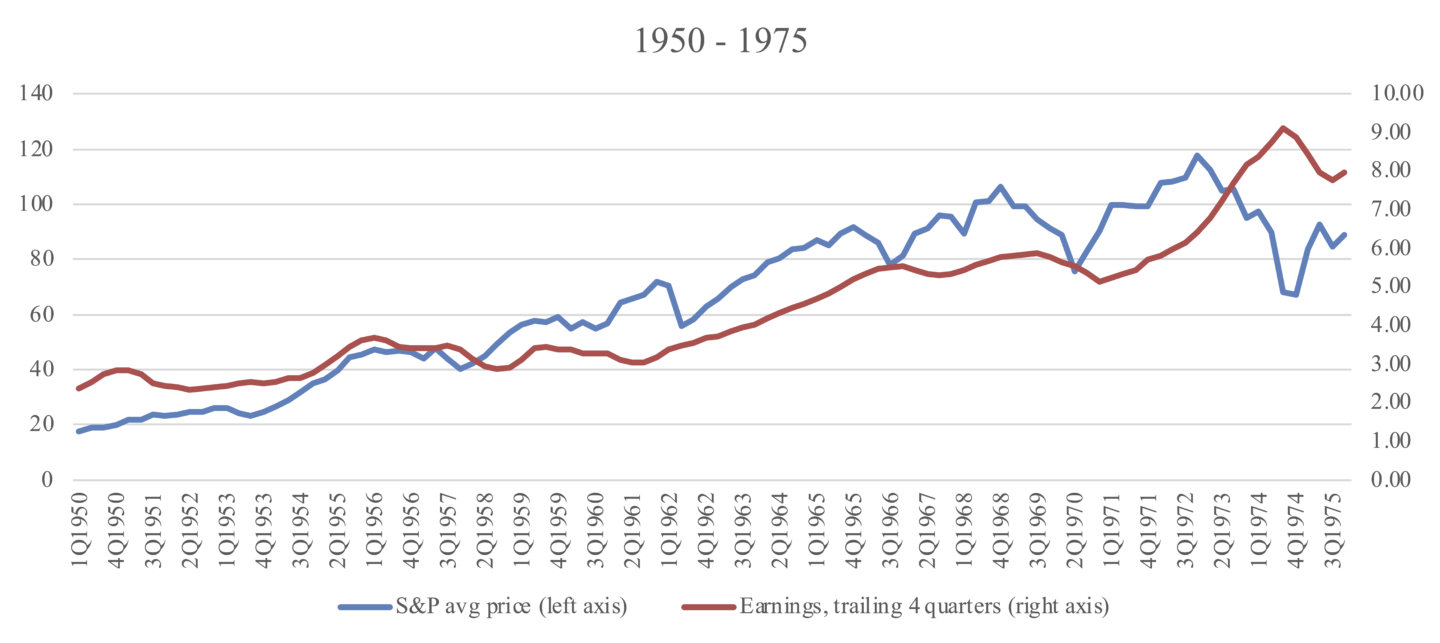
Source: Dr. Robert Shiller, Yale School of Management; Business Insider; Archer Bay Capital LLC
The years following the second world war felt tenuous at the time. Communist and nationalist revolutions, dismantling of colonial rule, assassinations, labor strikes, the Korean and Vietnam wars, large scale civil protests, and environmental disasters were extremely disruptive and tragic. Yet we moved forward.
The oil embargo in the early 1970s led to price spikes and fear of shortages. Consumers stocked up on goods and kept their gas tanks full, exacerbating the problem. So much uncertainty took its toll on stock prices even though earnings held up surprisingly well.
Technological innovation, medical advancements, and lower trade barriers, all contributed to higher living standards and a rapidly expanding economy. It wasn’t a straight line, but the slope was upward.
Inflation, Savings & Loan crisis, the first Gulf War, end of Cold War, Tech Bubble
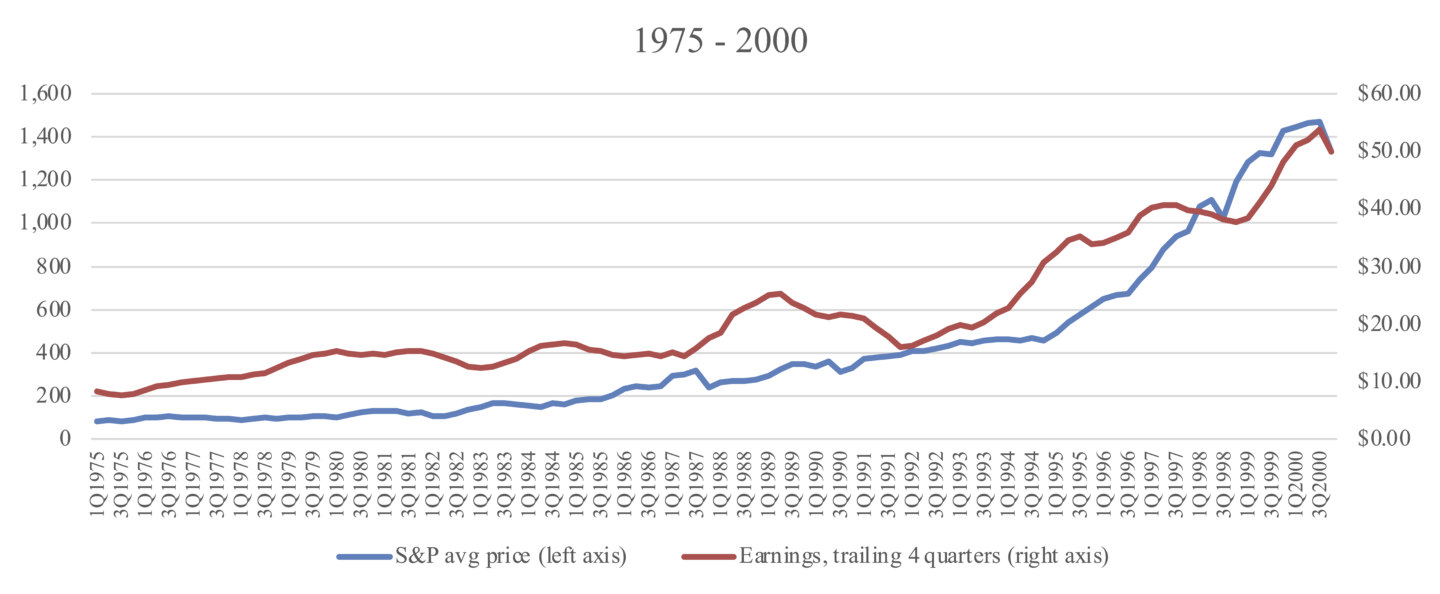
Source: Dr. Robert Shiller, Yale School of Management; Business Insider; Archer Bay Capital LLC
If you just looked at the chart and didn’t know the history, it looks like the last 25 years of the 20th century was a breeze. The stock market crash in October 1987 is a blip which quickly recovered. Corporate earnings suffered substantially in the time leading up to the 1990 recession as banks failed from bad real estate and oil loans, but stock investors seemed to look through it.
In fact, investors dismissed all bad news as insignificant as they expected technology companies to fix all of the world’s problems. Optimism was rewarded with ever higher prices, despite earnings starting to decline in the third quarter of 2000.
Stock valuations were at record levels in 2000. Price/Earnings multiples were nearly 30x at the peak. As a comparison for today, the P/E multiple was 20x in early February, before COVID19 spread broadly. It is now 15x but we don’t know where earnings will level out.
9/11 Terror attacks, Iraq and Afghanistan Wars, Global Financial Crisis, COVID19

Source: Dr. Robert Shiller, Yale School of Management; Business Insider; Archer Bay Capital LLC
We started this century with terrorist attacks, a decline in corporate earnings that lasted nearly three years, and the start of the longest war the US has ever fought. In the past twenty years, we’ve had the tech bubble pop and a new bubble develop in real estate, which ultimately led to the global financial crisis.
Through all of the uncertainty, the economy continues to adapt. Not all companies survive. Because the stocks in S&P 500 index change, the weaker ones will drop out and new ones take their place. Our capitalist model drives the evolution of business. The winners and losers are clearly seen in the stock market.
Every crisis we face is unique but patterns emerge. During peak uncertainty, the credit markets (bonds and loans) freeze up as people and businesses rush to hold cash. The stock market plunges as investors become focused on the very short term and worry where the bottom will be.
Anyone who speaks about the future recovery is seen as naïve. The pundits who are permanently bearish get their day in the sun. Once the severity of the threat is known, everyone who has been sitting on cash starts to reinvest. The cautious ones wait to be certain and sit out the early rise, which is usually the strongest. If your investment timeframe is one to two years, you shouldn’t be in stocks, period. If your investment timeframe is your lifetime through retirement, the best returns are ultimately going to come from the businesses who evolve and thrive.
Take care of your health and take this threat seriously so that we can move more quickly past it—for the benefit of you, your family, your community, and your investments.
At Archer Bay Capital, we help navigate our clients through market volatility so we can make better financial decisions together. Contact us to discuss stocks, earnings and our forecast in greater detail, or to schedule a consultation today.