



Three Risks in the Market
In this report, we present the various data we are monitoring, what we believe the data is telling us, and how the risks in the market are reflected in performance.
Risk #1: Stubborn inflation and rising interest rates.
In general, the Federal Reserve targets a long-term inflation rate of 2.0%. However, inflation has been running hotter than that. The average annualized rate of the Consumer Price Index (CPI) is 3.2% year-to-date, and the latest reading for August was 3.4%. Bond investors are concerned about persistently high inflation, which is why the Federal Reserve raised rates by 0.25% this month.
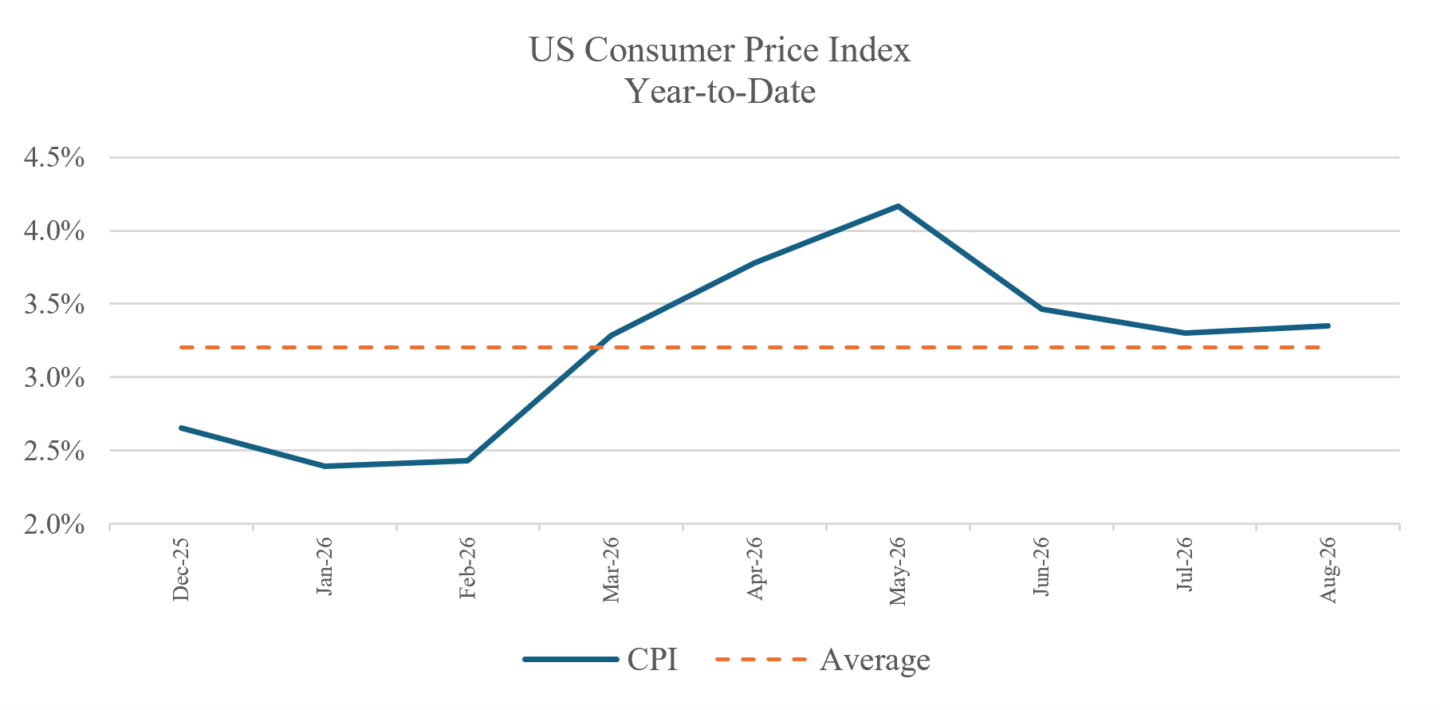
Source: U.S. Bureau of Economic Analysis; FactSet Research Systems; Archer Bay Capital LLC
Although the Federal Reserve has kept overnight interest rates steady for most of this year, rising inflation has driven rates higher overall, as shown in the graph below.
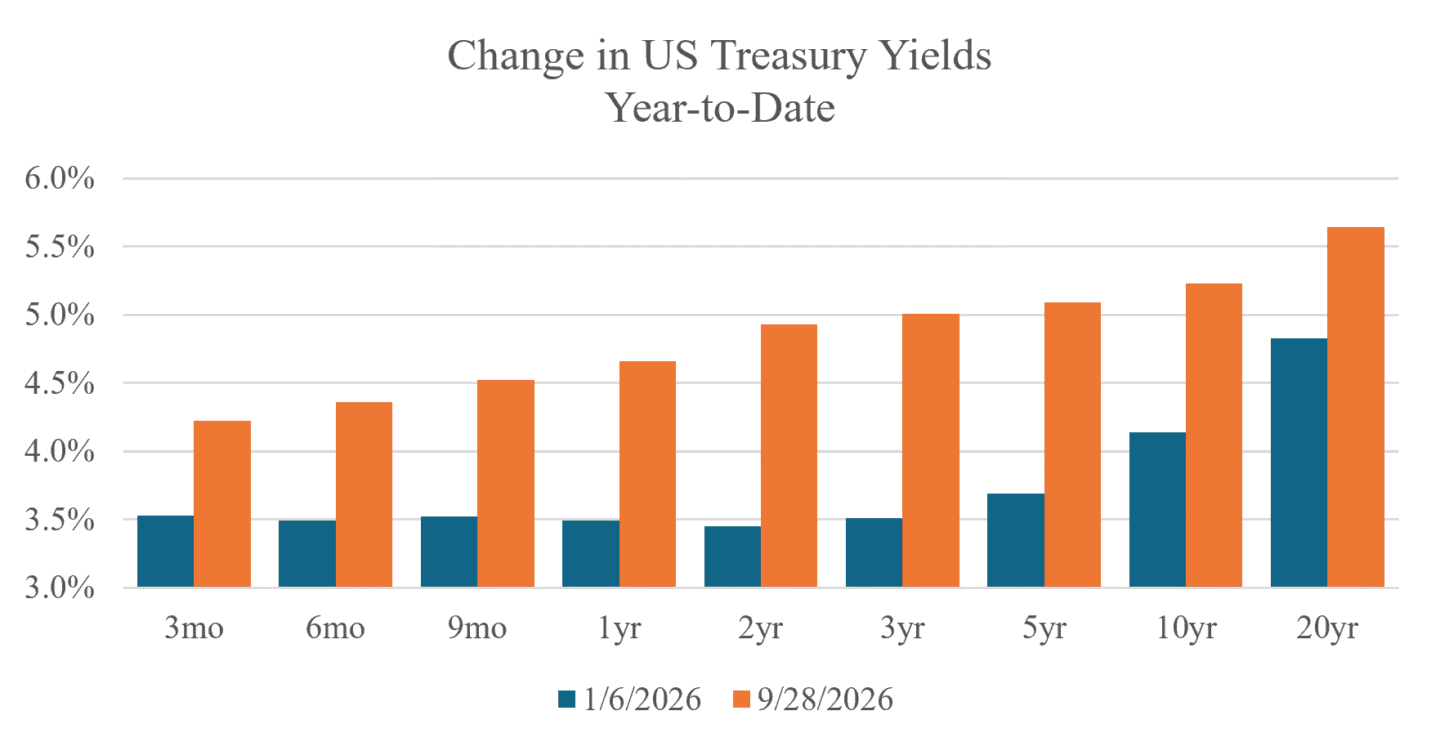
Source: Fidelity Investments; Archer Bay Capital LLC
Risk #2: Can stock market growth continue?
To better understand stock prices, we analyze the trend in corporate profits. It has been a very strong year for corporate profits, which we covered in greater detail in our July blog.
The key factors driving earnings growth include increased capital spending, product and services price increases, beneficial tax changes, and higher margins from productivity gains. Historically, corporate profits tend to grow except during recessions.
The chart below shows the monthly change in forward earnings-per-share for the S&P 500 over the past year compared to the change in the S&P 500 price.
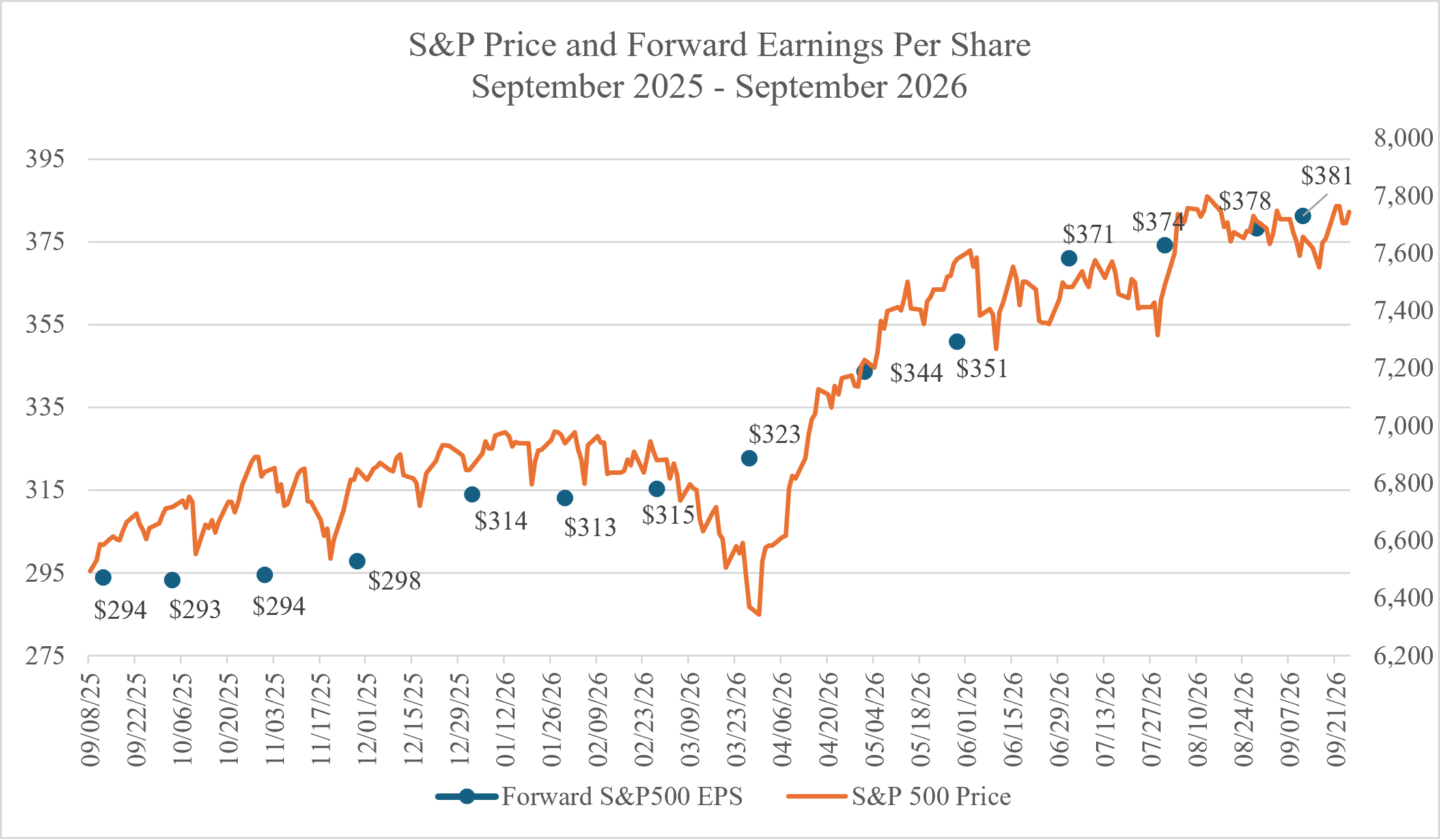
Source: FactSet Research Systems; LSEG Earnings Scorecard; Archer Bay Capital LLC
Risk #3: US dollar weakness and geopolitical tensions.
Academic research has not shown a causal link between the change in the US dollar exchange rates and stock market prices1. Unlike historic stock performance data, market-driven currency exchange rates are relatively recent so the data spans only a few business cycles.
Currency exchange rates relative to the US dollar were fixed following the Bretton Woods Conference in 1944 to help provide economic stability during and after World War II. Exchange rates were allowed to float freely in 1973. While the relationship between currency and the performance of international stocks versus US stocks may not be direct, the chart below shows some relationship does appear to exist.
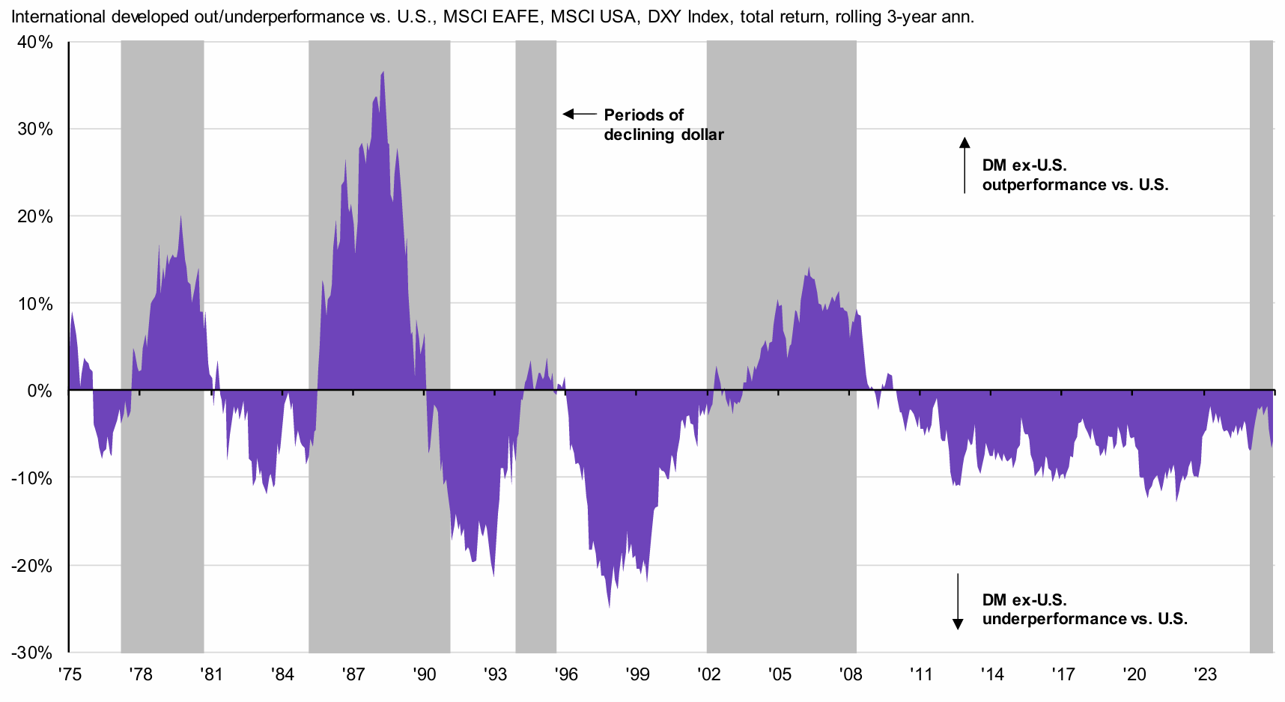

While international tensions simmer in the background, non-US companies have benefitted from higher spending in their own regions.
Separate from currency moves, the impact of geopolitical events on stock prices tends to revolve around whether the event is expected to affect corporate earnings. An example of this is higher oil prices caused by the war with Iran. Higher oil prices impact companies to varying degrees, and often companies can pass along these costs to the consumer via price increases.
Conclusion
In the chart below, we show the returns of international stocks, US stocks, US bonds, and the US dollar indexes since the start of 2025. The dollar has declined during this period, but both equity and bond markets are up.
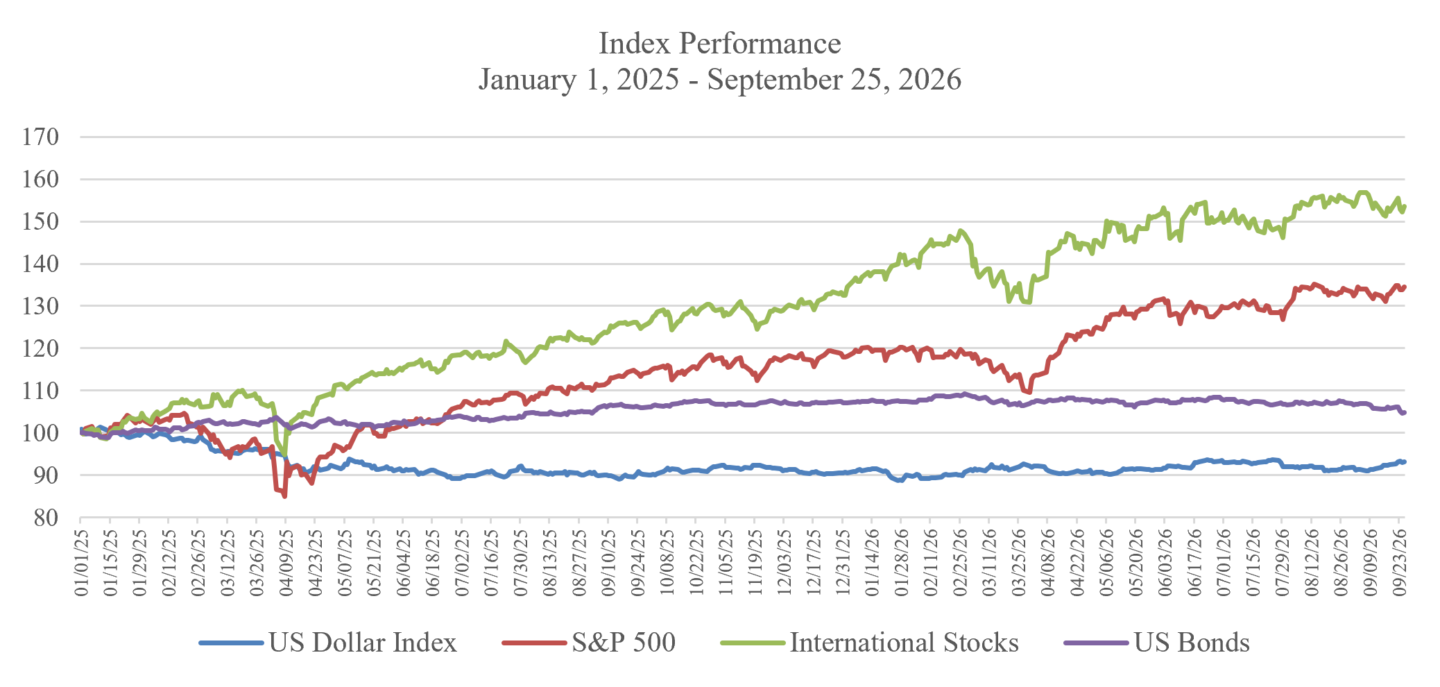
Source: Factset Research Systems; Archer Bay Capital LLC
Politics and the economy will always bring uncertainty, but some trends have held true through both strong and weak markets. Asset allocation has been the biggest driver of portfolio returns, and over time, stock prices have closely tracked corporate profits. Focusing on these fundamentals, rather than the headlines, is how we build lasting results.
Please let us know if you would like to discuss in greater detail.
Reference: Impact of exchange rate fluctuations on US stock market returns. Authors: Vivek Bhargava and Daniel Konku