

Are Markets Expecting a Recession?
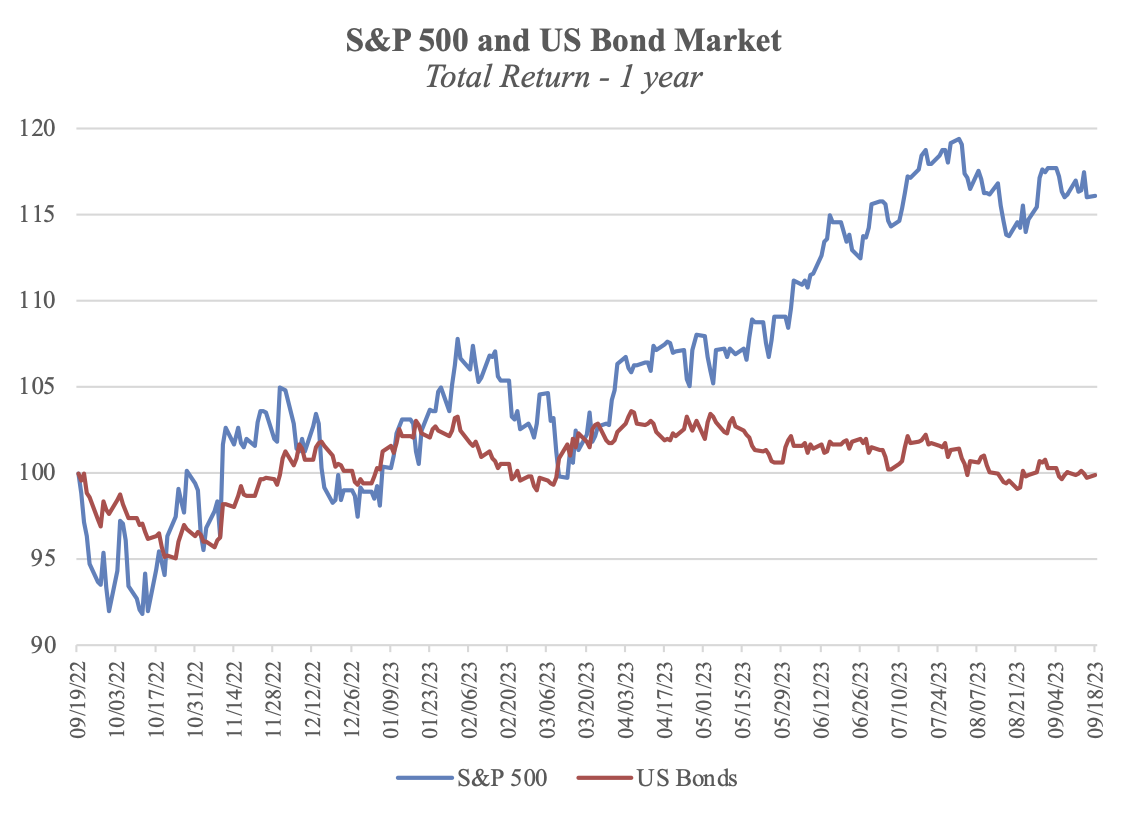
Source: FactSet Research Systems (S&P 500 and the Bloomberg US Bond Aggregate); Archer Bay Capital LLC
At this time last year, the financial markets were pessimistic about everything. Both bond and stock values were down. Corporate profits were declining, inflation was high, and the Federal Reserve was raising interest rates at the fastest pace seen in a generation.
The US economy did contract in the first half of 2022, but a recession was not officially declared. Excluding the energy sector, which boomed from the spike in oil prices as a result of the Russian war in Ukraine, overall corporate profits declined year-over-year for four quarters in a row - from April 2022 until March 2023.
A Corporate Earnings Recession Already Happened
The 500 companies that make up the S&P 500 can be sorted into eleven industry sectors. The sectors are not equally weighted – the size of the sector depends on the value of the companies within it. Last year the largest profit declines were fairly broad-based among large and small sectors.
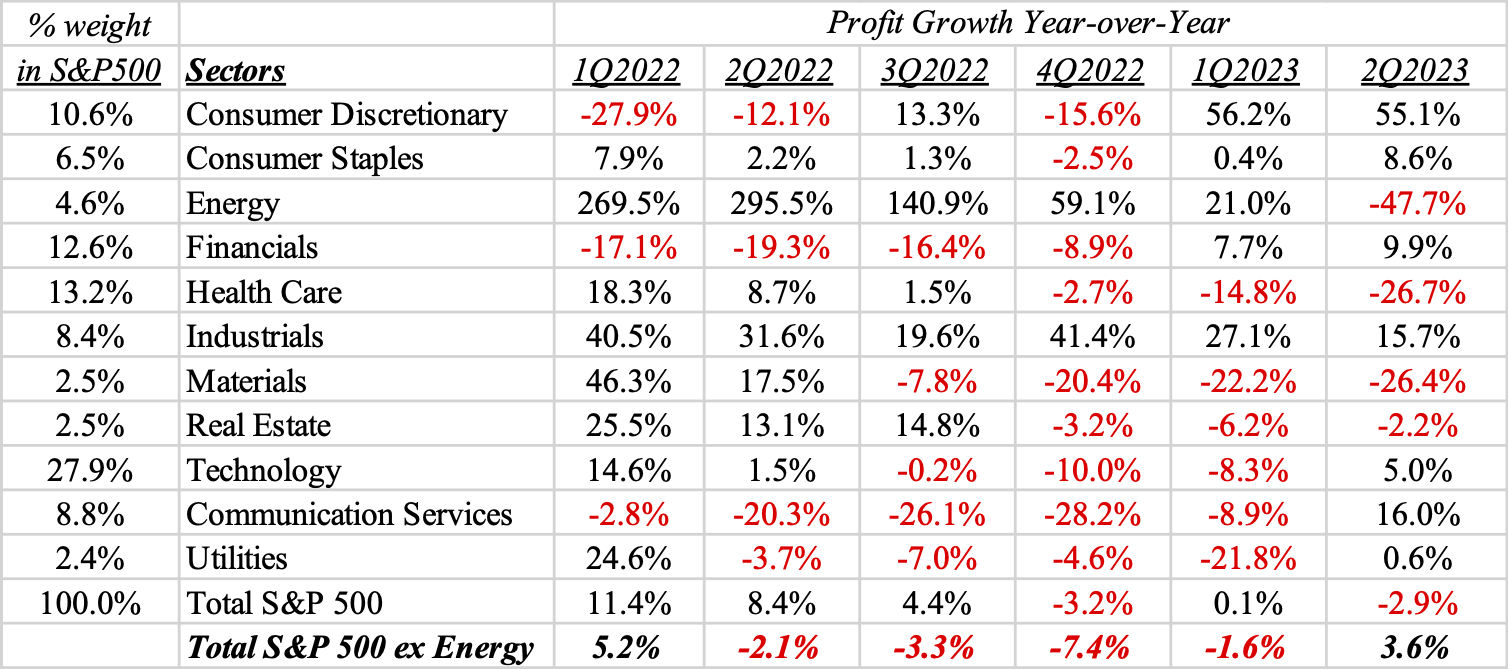
Source: Refinitiv; Archer Bay Capital LLC
A list of the companies by sector is available on the iShares website HERE.
What is Expected Going Forward?
When companies go through a period of profit declines, management teams tend to quickly adapt and to make whatever operating adjustments they need to restore growth and profit margins. Currently Wall Street analysts are expecting a recovery in earnings growth this quarter due to changes that company managements have made over the past year. Healthy profit growth is forecasted over the next year.
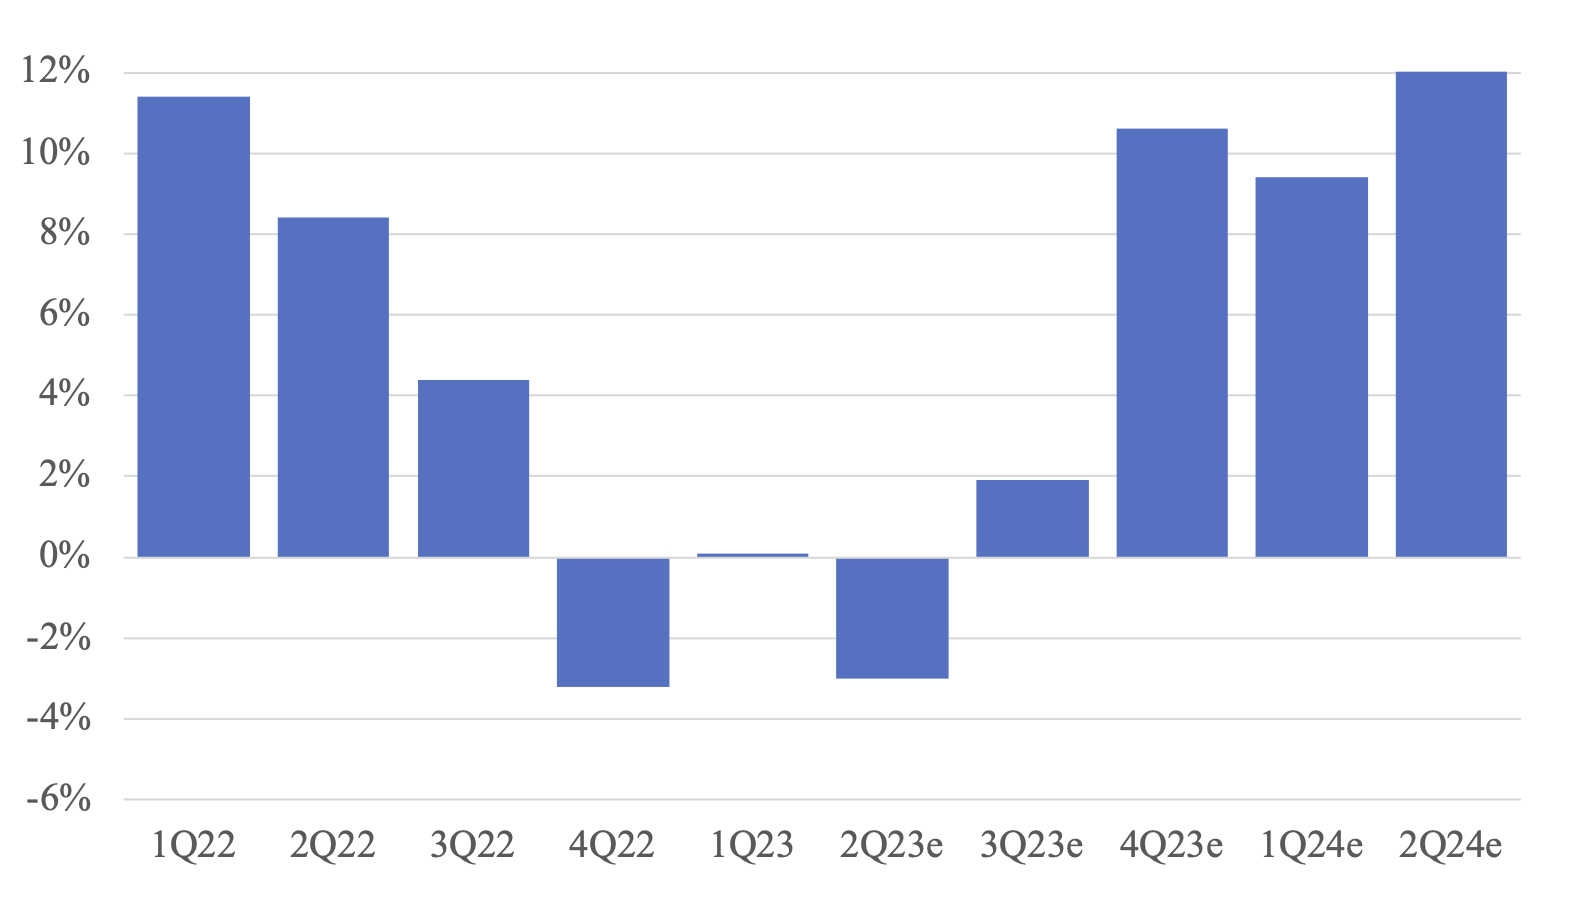
Source: Refinitiv; Archer Bay Capital LLC
Many Economists Predicting Recession
In contrast to the rosy forecasts from Wall Street analysts, many economists are expecting a recession instead.
There are multiple reasons to expect a recession in the coming year: Higher interest rates increase costs for borrowers, leaving them with less money for other purchases. High mortgage rates have already contributed to a slowdown in the housing market. The money supply has been reduced due to the Federal Reserve shrinking its balance sheet. Banks have become more reluctant to lend to commercial borrowers. And inflation has improved, although it is still above the Federal Reserve’s long-term target of 2% per year.
Strong Labor Market is Keeping the Economy Growing
But there are counterpoints to the slowdown. The major bright spot is the strong labor market. There are more job postings than unemployed workers who are looking for a job. Due to the low unemployment rate, wages are growing faster than inflation; workers are earning real increases in wages.
The shortage of workers appears structural – many older workers who took early retirement during the pandemic have not returned to the workforce and immigration has not returned to the previous growth rate prior to the pandemic. It is estimated that the workforce is ‘missing’ more than two million workers from those two categories.
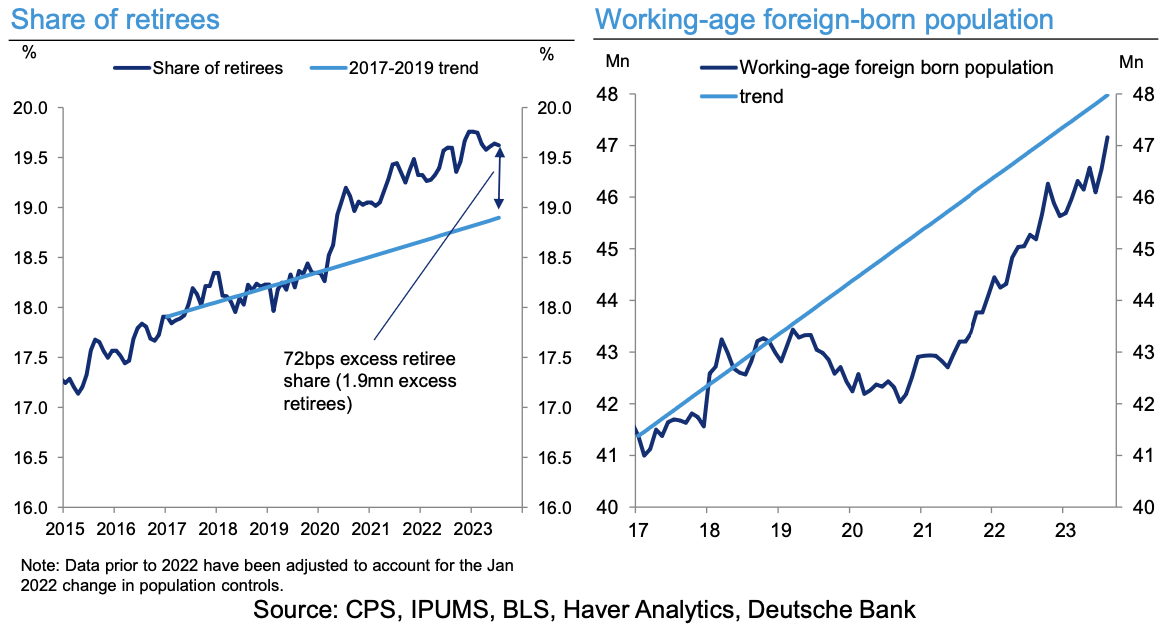
For the labor market to get back in balance, either a reduction of job openings or an increase in workers, or some of both, needs to happen.
Mixed Economic Signals, Mixed Stock Valuation
The economy is a mix of weakness on the debt side as borrowers adjust to higher interest rates and strength from the tight labor market with wage growth and low unemployment. But the economy and the stock market do not always move together. It is possible to have a weak economy and strong stocks and vice versa.
After the 22% decline in the S&P 500 in 2022 and approximately 17% gain in 2023 (to date), it is possible that stocks priced in a recession last year and are now moving forward. Looking at the broader stock market, not all areas of the market have recovered to the same extent as the S&P 500 in 2023. Valuation for mid-size and smaller stocks still looks attractive, while the S&P 500 looks more expensive.
One of the valuation measures that we monitor is the Price/Earnings (P/E) ratio to get a sense of how expensive or inexpensive the indexes are. If we compare large stock valuation to smaller stock valuation, there is a stark contrast between to the two, as shown in the charts below.
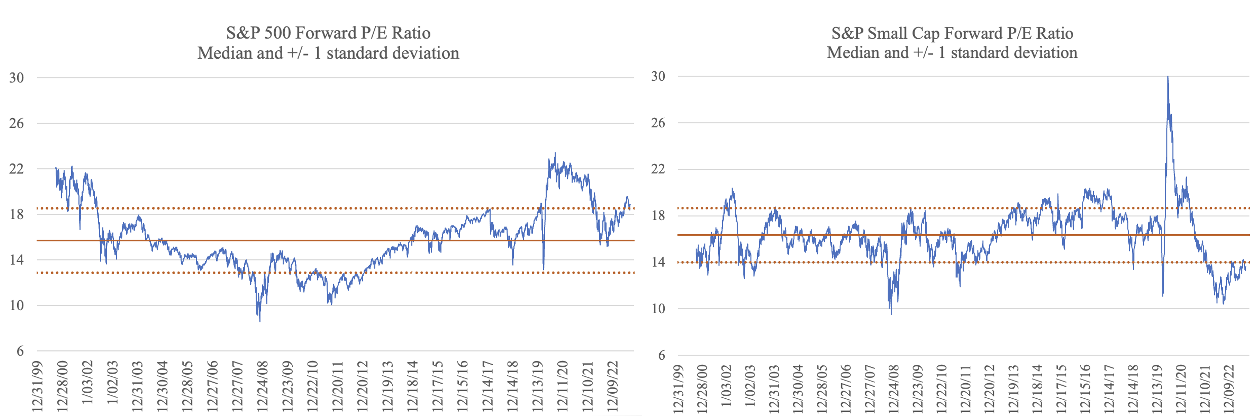
Source: FactSet Research Systems; Archer Bay Capital LLC
In this chart, the dotted lines represent the standard deviation of the P/E ratio. Standard deviation essentially measures the variability of the P/E ratio and by definition, it will fall into the range of +1 to minus-1 standard deviation about 2/3rds of the time.
Currently, the S&P 500 is trading one standard deviation above its median P/E level and at the same time, the S&P Small Cap Index is trading one standard deviation below its P/E level, which is uncommon. Our take-away from these measures is that there is some negative news already priced in some segments of the market and we need to look beyond the news headlines about recession and stock prices.
Taking a Longer View
There is always uncertainty in the future which is what makes investing so intellectually interesting and emotionally scary. To get past the fear of uncertainty, our approach is to let the data guide us.
The economic data is sending mixed signals about what lay ahead, but bond yields are back above the inflation rate and corporate profit forecasts are attractive. Stock valuation remains mixed, but there is still opportunity in the segment of the market that hasn’t returned to normal yet. Because we see opportunities both in bonds, due to higher yields, and in equities, with earnings growth, we continue to stay invested through the near-term economic ups and downs.