
A Wayfair Inc. Stock Report (NYSE:W)
Reported earnings for fiscal year 2018: -$5.63 per share
Consensus earnings estimate for fiscal year 2019: -$4.91 per share
Consensus earnings estimate for fiscal year 2020: -$4.01 per share
Source: Factset, Archer Bay Capital LLC
Wayfair Inc. reported fourth-quarter results on Friday morning and Wall Street loved it. Earnings loss per share was better than expected and the management team was very upbeat about the progress that the company has made in multiple areas, including international expansion, logistics, and customer engagement metrics. So why did Wall Street get so excited if the company is still losing money and is expected to continue to lose money for at least the next two years?
It’s all about growth.
Revenue growth for the company is still going strong. Management provided guidance for the first quarter of 2019 for sales growth between 33 to 36 percent in the US and a range of 35 to 40 percent growth internationally, — despite some currency headwinds.
Wall Street analysts have funneled that optimism into full-year sales growth estimates of +33 percent for 2019 and +28 percent for 2020.
It’s hard to find growth rates like that anywhere.
What about earnings?
When companies are growing fast, they need to spend a lot to build out the infrastructure and hire staff — which is happening at Wayfair — and this hurts profit margins in the near term. But not all expenses that must be reported for Generally Accepted Accounting Principals (GAAP accounting) require a cash outlay.
The two biggest expenses for Wayfair that do not require actual cash — but must be reported — are as follows:
1) Depreciation expense for property, plant, and equipment
2) The stock option portion of employees’ compensation.
3) Together, these costs totaled $251 million in 2018 which is the equivalent of $2.80 per share. The company is still losing money even when those costs are added back, but it is half the loss that was reported.
The Wayfair Inc. business model
What makes up the difference in losses is related to its business model. The general public recognizes Wayfair as a furniture and home furnishings company, but they function more as a home goods logistics company. This is similar to how Amazon is a marketplace for many retailers and is not just selling its own inventory. Additionally for both Wayfair and Amazon, when an order is placed online, the customer pays upfront.
When an order comes in, it is routed to the supplier that holds the inventory, and then the item is shipped out to the buyer. Because Wayfair receives payment before shipping, and because the supplier is responsible for making the item and holding the inventory, Wayfair receives cash flow that isn’t reflected in either sales or costs until after the order is delivered.
For a company that is growing as fast Wayfair, it means more cash is coming in each quarter than is recognized in revenue. This figure shows up in “Changes in Working Capital” in the cash flow statement. Last year, the excess in cash over revenue inflow was $315.3 million, which plugs the hole for the remaining negative earnings.
Net Cash Flow from Operations for 2018 was actually positive $0.95 per share. That is very different than a GAAP earnings loss of -$5.63 and it gives the company cash to fuel its own growth.
Wayfair did issue some debt in November 2018 to help build more warehouses and logistics capabilities, but the overall debt level is modest given its size. Long-term debt is $738.9 million, total assets are $1.89 billion, and the interest rate on the new debt is very low at 1.125% because it was structured as convertible to equity.
Accounting and assumptions
So, we know why the company is viewed so positively even when they have negative earnings, but the more important question is what to do with the stock. The hardest stocks to value are companies that have a relatively short history as a public company and companies that are losing money, as measured by GAAP earnings.
Wayfair is both.
Management is aware of the difficulty in analyzing a young and fast-growing company and they provide additional information beyond what is required by GAAP. One of the data points they have provided is Total Addressable Market or TAM.
Management estimates that the overall size of the furniture and home goods market is roughly $300 billion in the U.S. and another $300 billion in Europe.
In the US, they estimate about 15 percent of home purchases (or $45 billion) is made online and the remaining 85 percent is purchased at physical stores. Wayfair’s revenue in the US was $5.8 billion, so that implies market share of the online business of 13 percent and less than 2.0% of the overall US market.
Wayfair Inc. and growth
Wayfair Inc. is growing in two ways. First, Wayfair is taking more market share online, and secondly, it is capturing more of the physical store market — and that doesn’t include anything in Europe.
Management also provided very helpful guidance on what they are targeting for future sustainable margins. Gross profit in the fourth quarter of 2018 was 24.4% and they believe they can increase it within the range of 25-27 percent. Operating expenses in the fourth quarter of 2018 were 27 percent of revenue and their target is to bring that down to 15-19 percent over time.
Remember: Stock prices reflect what the market believes will happen to a company — not what has already happened.
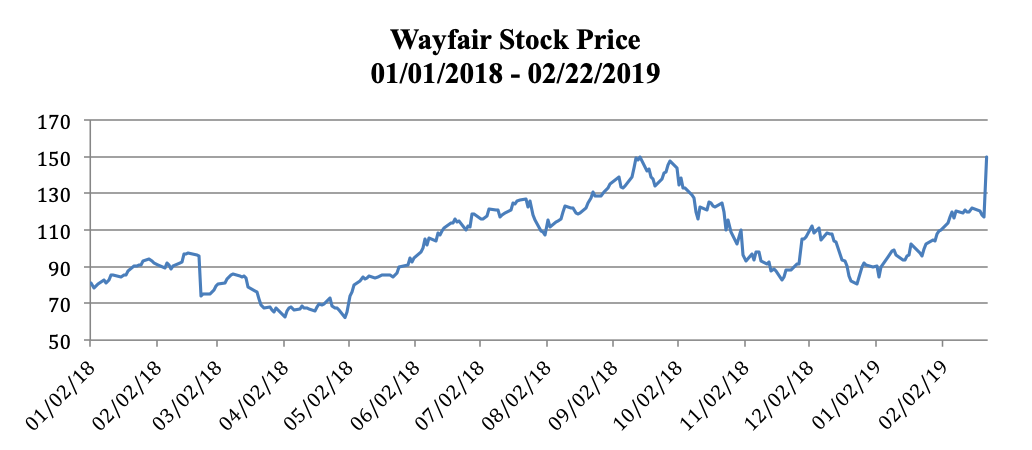
With Wayfair trading at $149.95 and using the data provided by the company, we can back into the assumptions that seem to be supporting the stock price.
This is geeky, analyst territory now, so bear with me:
1) The broader stock market is trading at a multiple of 16 times earnings.
2) At $149.95 per share —applying a market multiple — earnings should be $9.34 per share, or $845 million, assuming 90.5 million shares outstanding ($9.34 x 90.5 million shares = $845 million).
3) Using the long-term targets of 27 percent gross profit and 17 percent operating expenses would imply an operating profit margin of 10 percent.
4) If the future tax rate was 20 percent, and the stock is expected to earn $845 million, then the revenue would need to be $11.3 billion to justify the current stock price. This represents 25 percent of the current US online market or, alternatively, 1.8 percent market share of the US and Europe overall market combined.
Current Wall Street forecasts are for revenue growth of 33 percent this year and 28 percent in 2020. At this growth rate, the company will exceed $11.3 billion in revenue in 2020, but they aren’t expected to achieve the long-term margin goals for a while, so earnings losses will continue.
Opportunity amid volatility
For the Wayfair Inc. stock price to continue to climb, the company needs to meet sales growth targets and reach its margin goals. The revenue growth and gross margin targets look attainable and they have a strong, experienced management team. The trend toward more online home shopping is happening and the business model of receiving cash before sales is enviable.
The key to Wayfair Inc. stock’s success will depend on how well the company makes the transition from high growth investment to normalizing expenses. There is tremendous opportunity for the company, but with so many unknowns, expect a lot of volatility along the way.
At Archer Bay Capital, we believe that informed investors have the best chance of achieving financial independence. That’s why we deliver clear, concise overviews of economic and market events that may affect your investment decisions while also providing personalized guidance in managing your portfolio. Contact us today to learn more about our process or to set up a consultation.
Note: There are too many wide-ranging assumptions to create a meaningful price target. If revenue growth continues to hit target and margins improve, the stock should continue to climb. But any set back on sales growth, cash flow or expenses will be painful.