

Login

What is a Yield Curve?
There has been a lot of press lately on fear of an inverted yield curve in the bond market. What does it mean and why do we care? Let’s start with looking at a normal yield curve, which is the bond environment we are in right now. Conceptually, a yield curve is a graphical depiction of what a bond pays annually (the yield) for different maturities at a given point in time. It starts with a maturity in one month and ends with a bond maturity of 30 years (the 30 year US Treasury bond).
Said another way, if you wanted to know how much more yield you would earn for extending the maturity period of a bond you want to buy today, this chart shows you the difference.
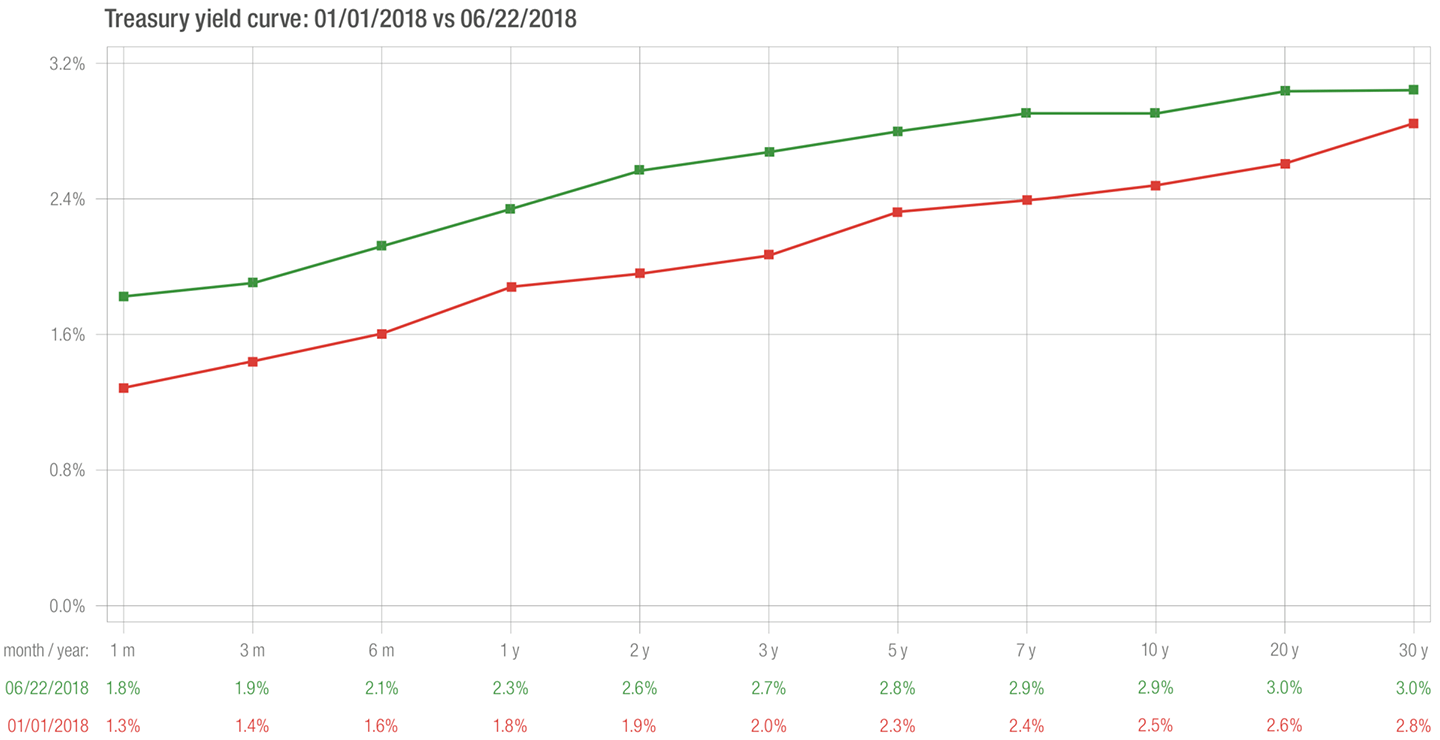
We know interest rates change over time. And different maturity bonds can change at different rates over time. In the graph above, we show two lines–the interest rates at the beginning of the year and what they are now. Today’s rates are slightly higher. And inflation is slightly higher, so it makes sense that interest rates, a.k.a. yields, are slightly higher. It is normal that bonds that mature later are pay a higher interest rate.
You would expect to be compensated more for buying a bond that matures in 10 years versus buying a bond that matures next year. In the chart above, as of last Friday, June 22, 2018, the 10-year US Treasury bond yield is 2.9 percent and the one year bond yield is 2.3 percent. You are not getting much additional yield for holding the bond another nine years.
At the beginning of the year, the 10 year US Treasury bond yielded 2.5 percent versus the one-year bond at 1.8 percent. There was a slightly bigger difference in yield between the two maturities at the beginning of the year than there is right now. At January 1, 2018, 2.5% – 1.8% = 0.7% difference in yield versus 2.9% – 2.3% = 0.6% difference now. Institutional bond investors care about small differences because their portfolios are enormous and it matters for very, very large accounts. They also care about changes because when the yield curve changes so much that the short-term rates are higher than long maturity rates, it frequently leads to a recession.
When a bond that matures in one year pays a higher interest rate than a bond that matures in 10 years, the yield curve is inverted, which is not normal. It is usually caused by some stress in the market, such as under the Reagan Administration when the Federal Reserve Chairman, Paul Volcker, raised short-term interest rates to 20 percent to stop runaway inflation. Notice in the previously posted blog, the inflation chart shows the CPI was nearly 14 percent at the start of 1980. Long term rates were lower than short term rates which slammed the breaks on the economy. The result was recession (and lower inflation).
An inverted yield curve is rare and it frequently prefaces a recession. It is something we monitor closely because recessions hit the stock market and the corporate bond market hard.
Source of Treasury Yield Curves: US Treasury